About Me
I'm passionate bout using GIS technology to get the most out of spatial data. Exploring data-driven insights in a way that emphasizes accuracy and ease of understanding is at the forefront of my design philosophy on any project, and I always strive to create maps that are detailed, informative, and will exceed client expectations every time. Included in this portfolio is a selection of projects both professional and personal that I am particularly proud of.
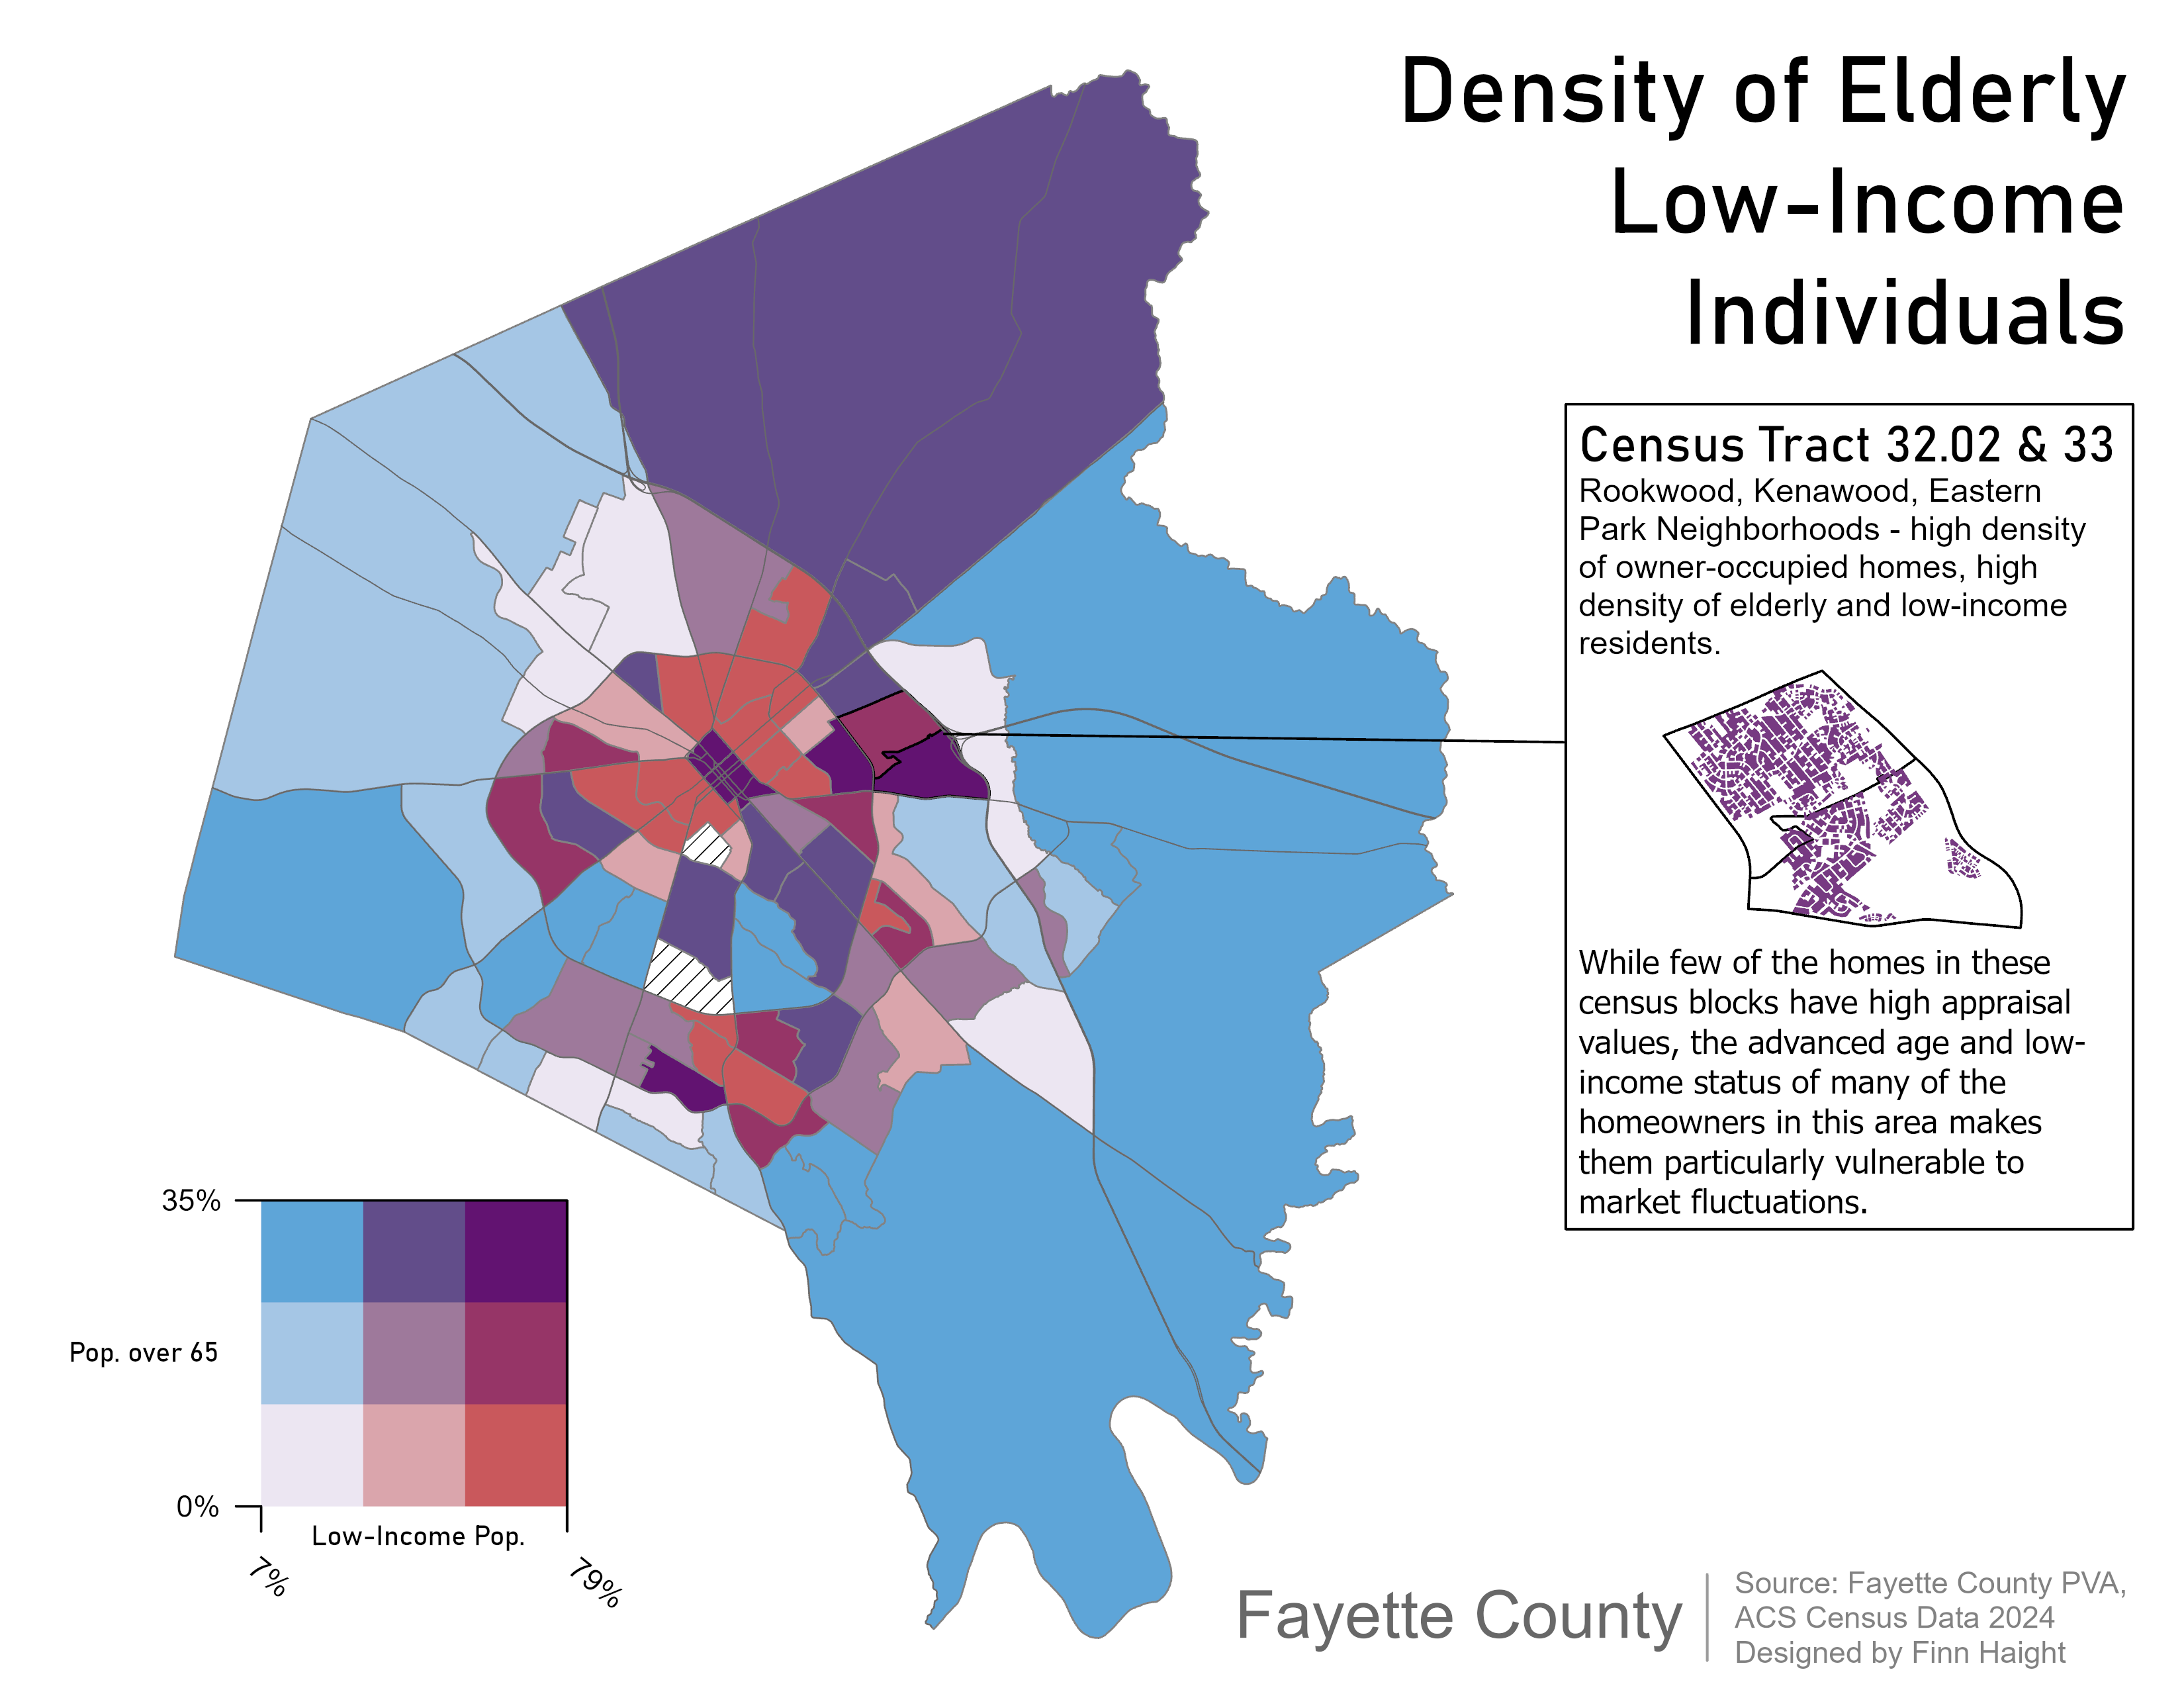
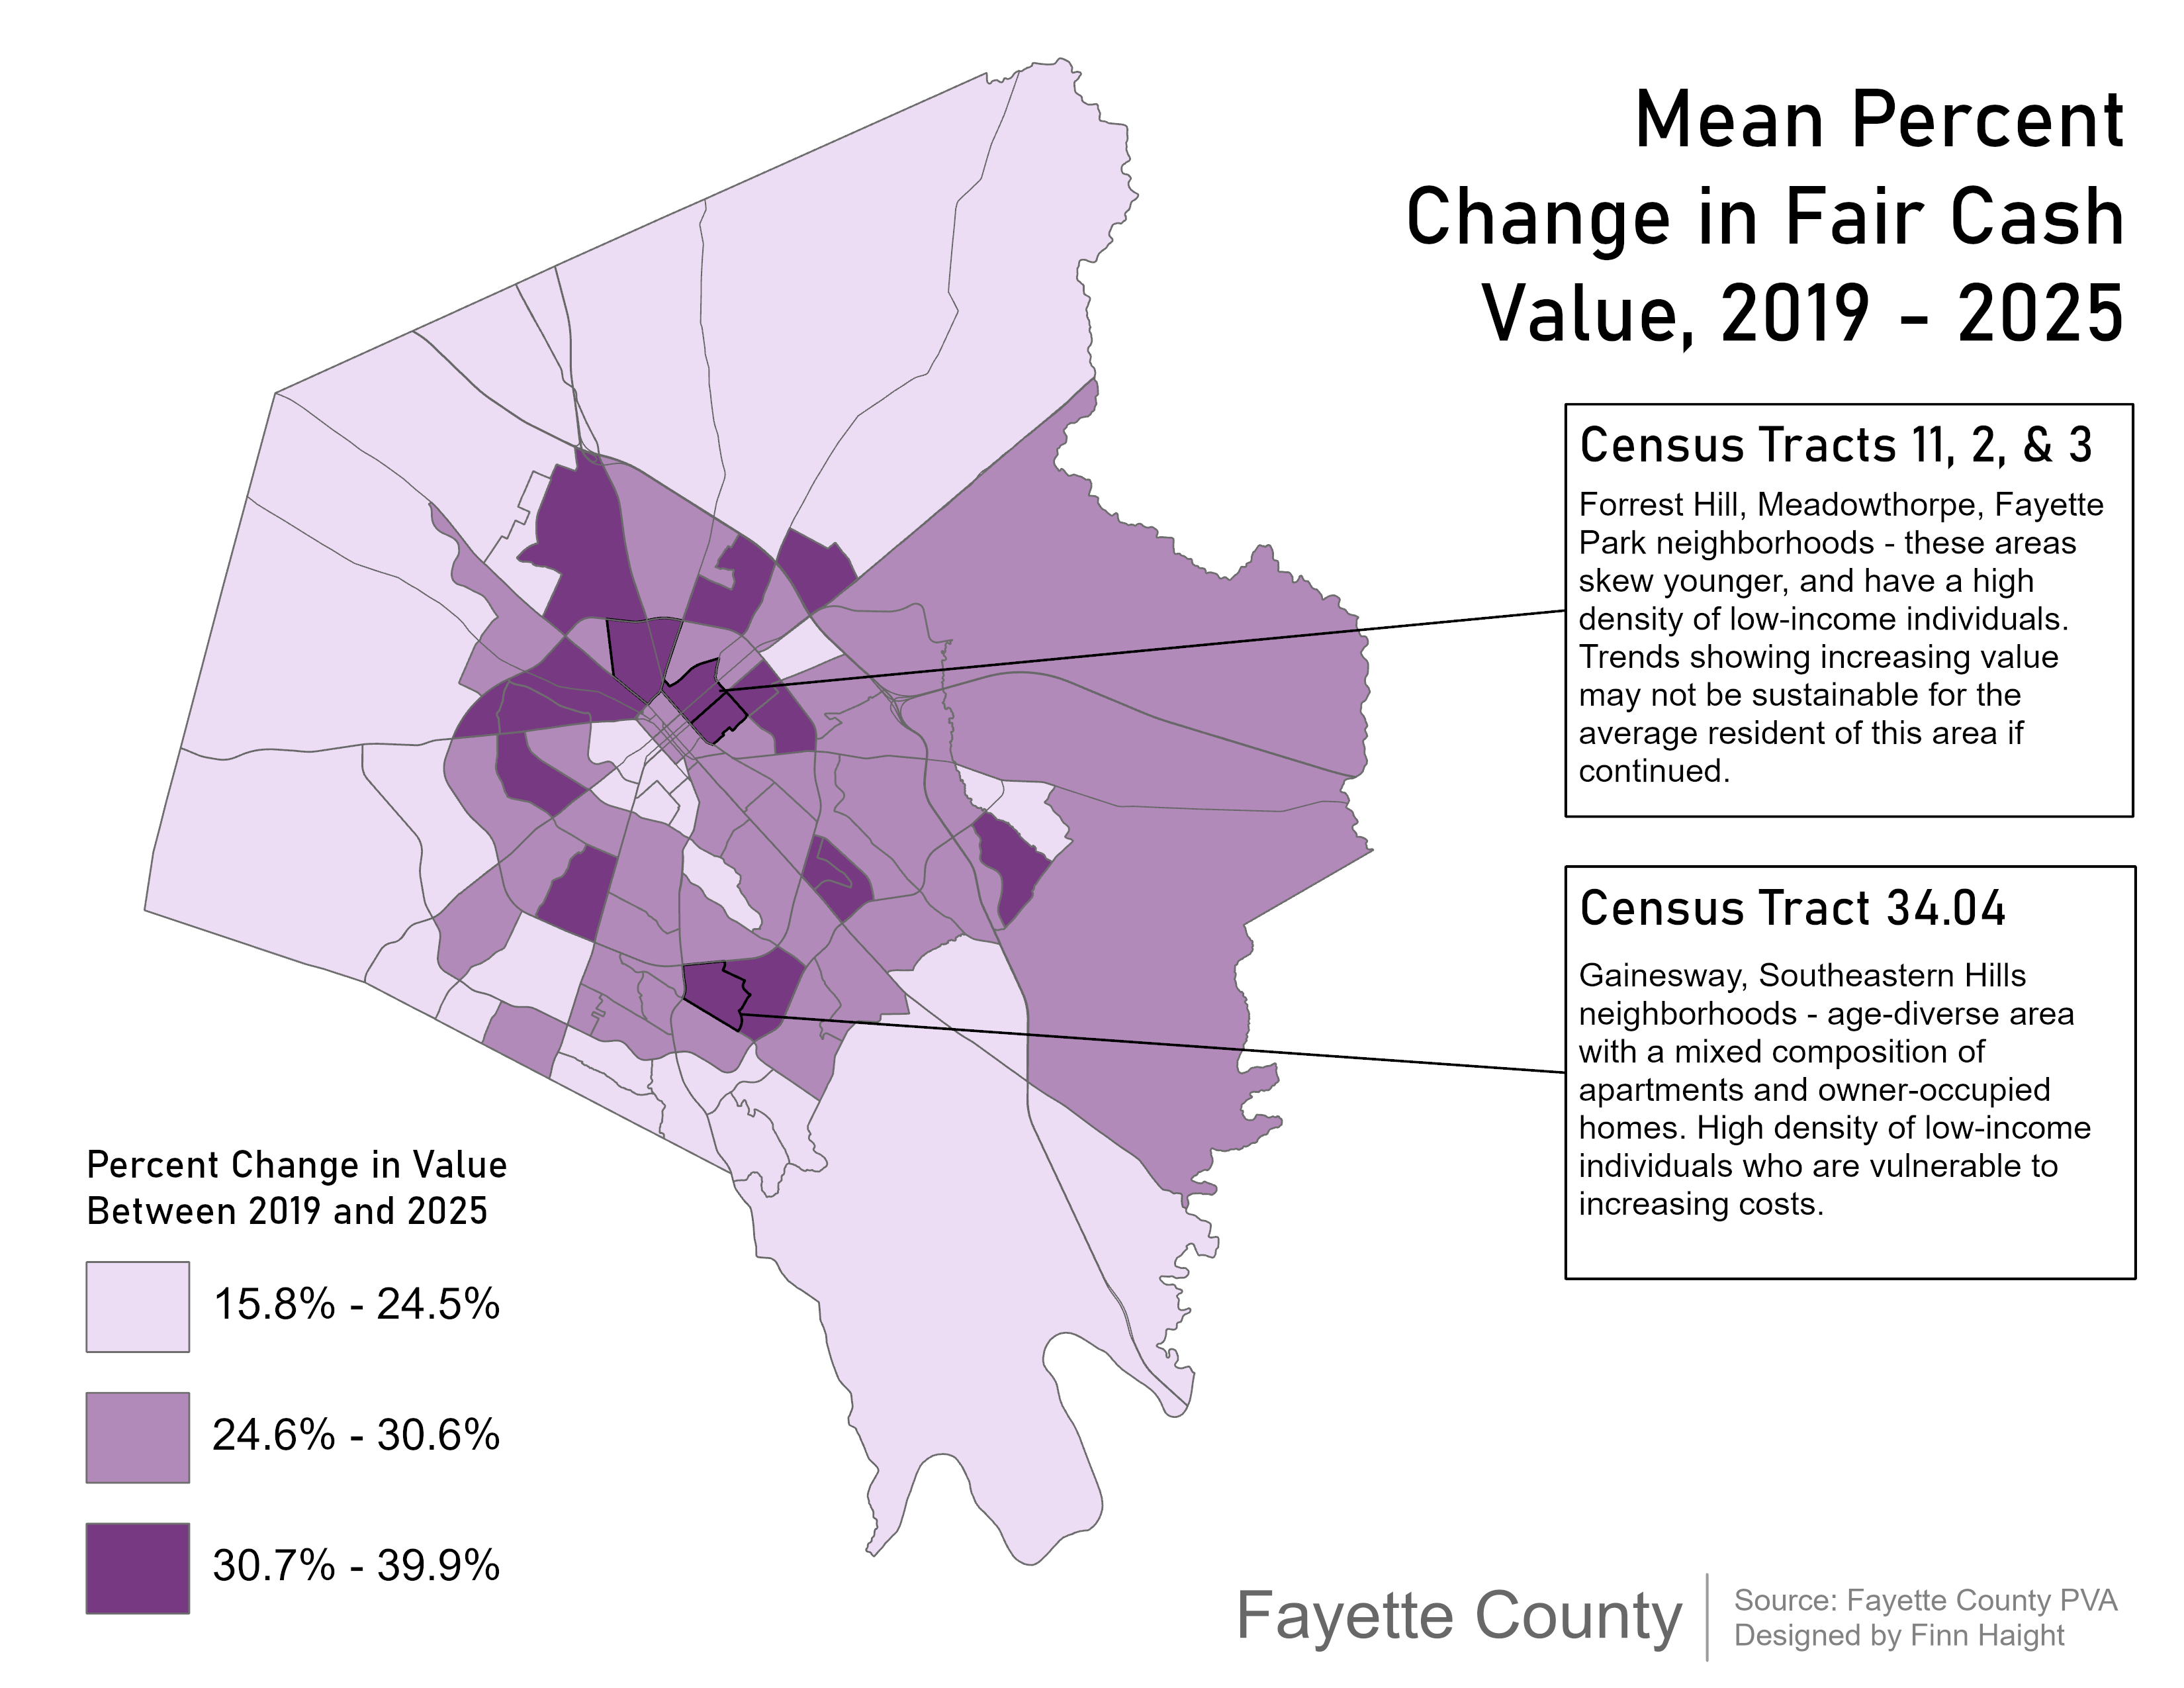
Fayette County Affordability Study, 2026
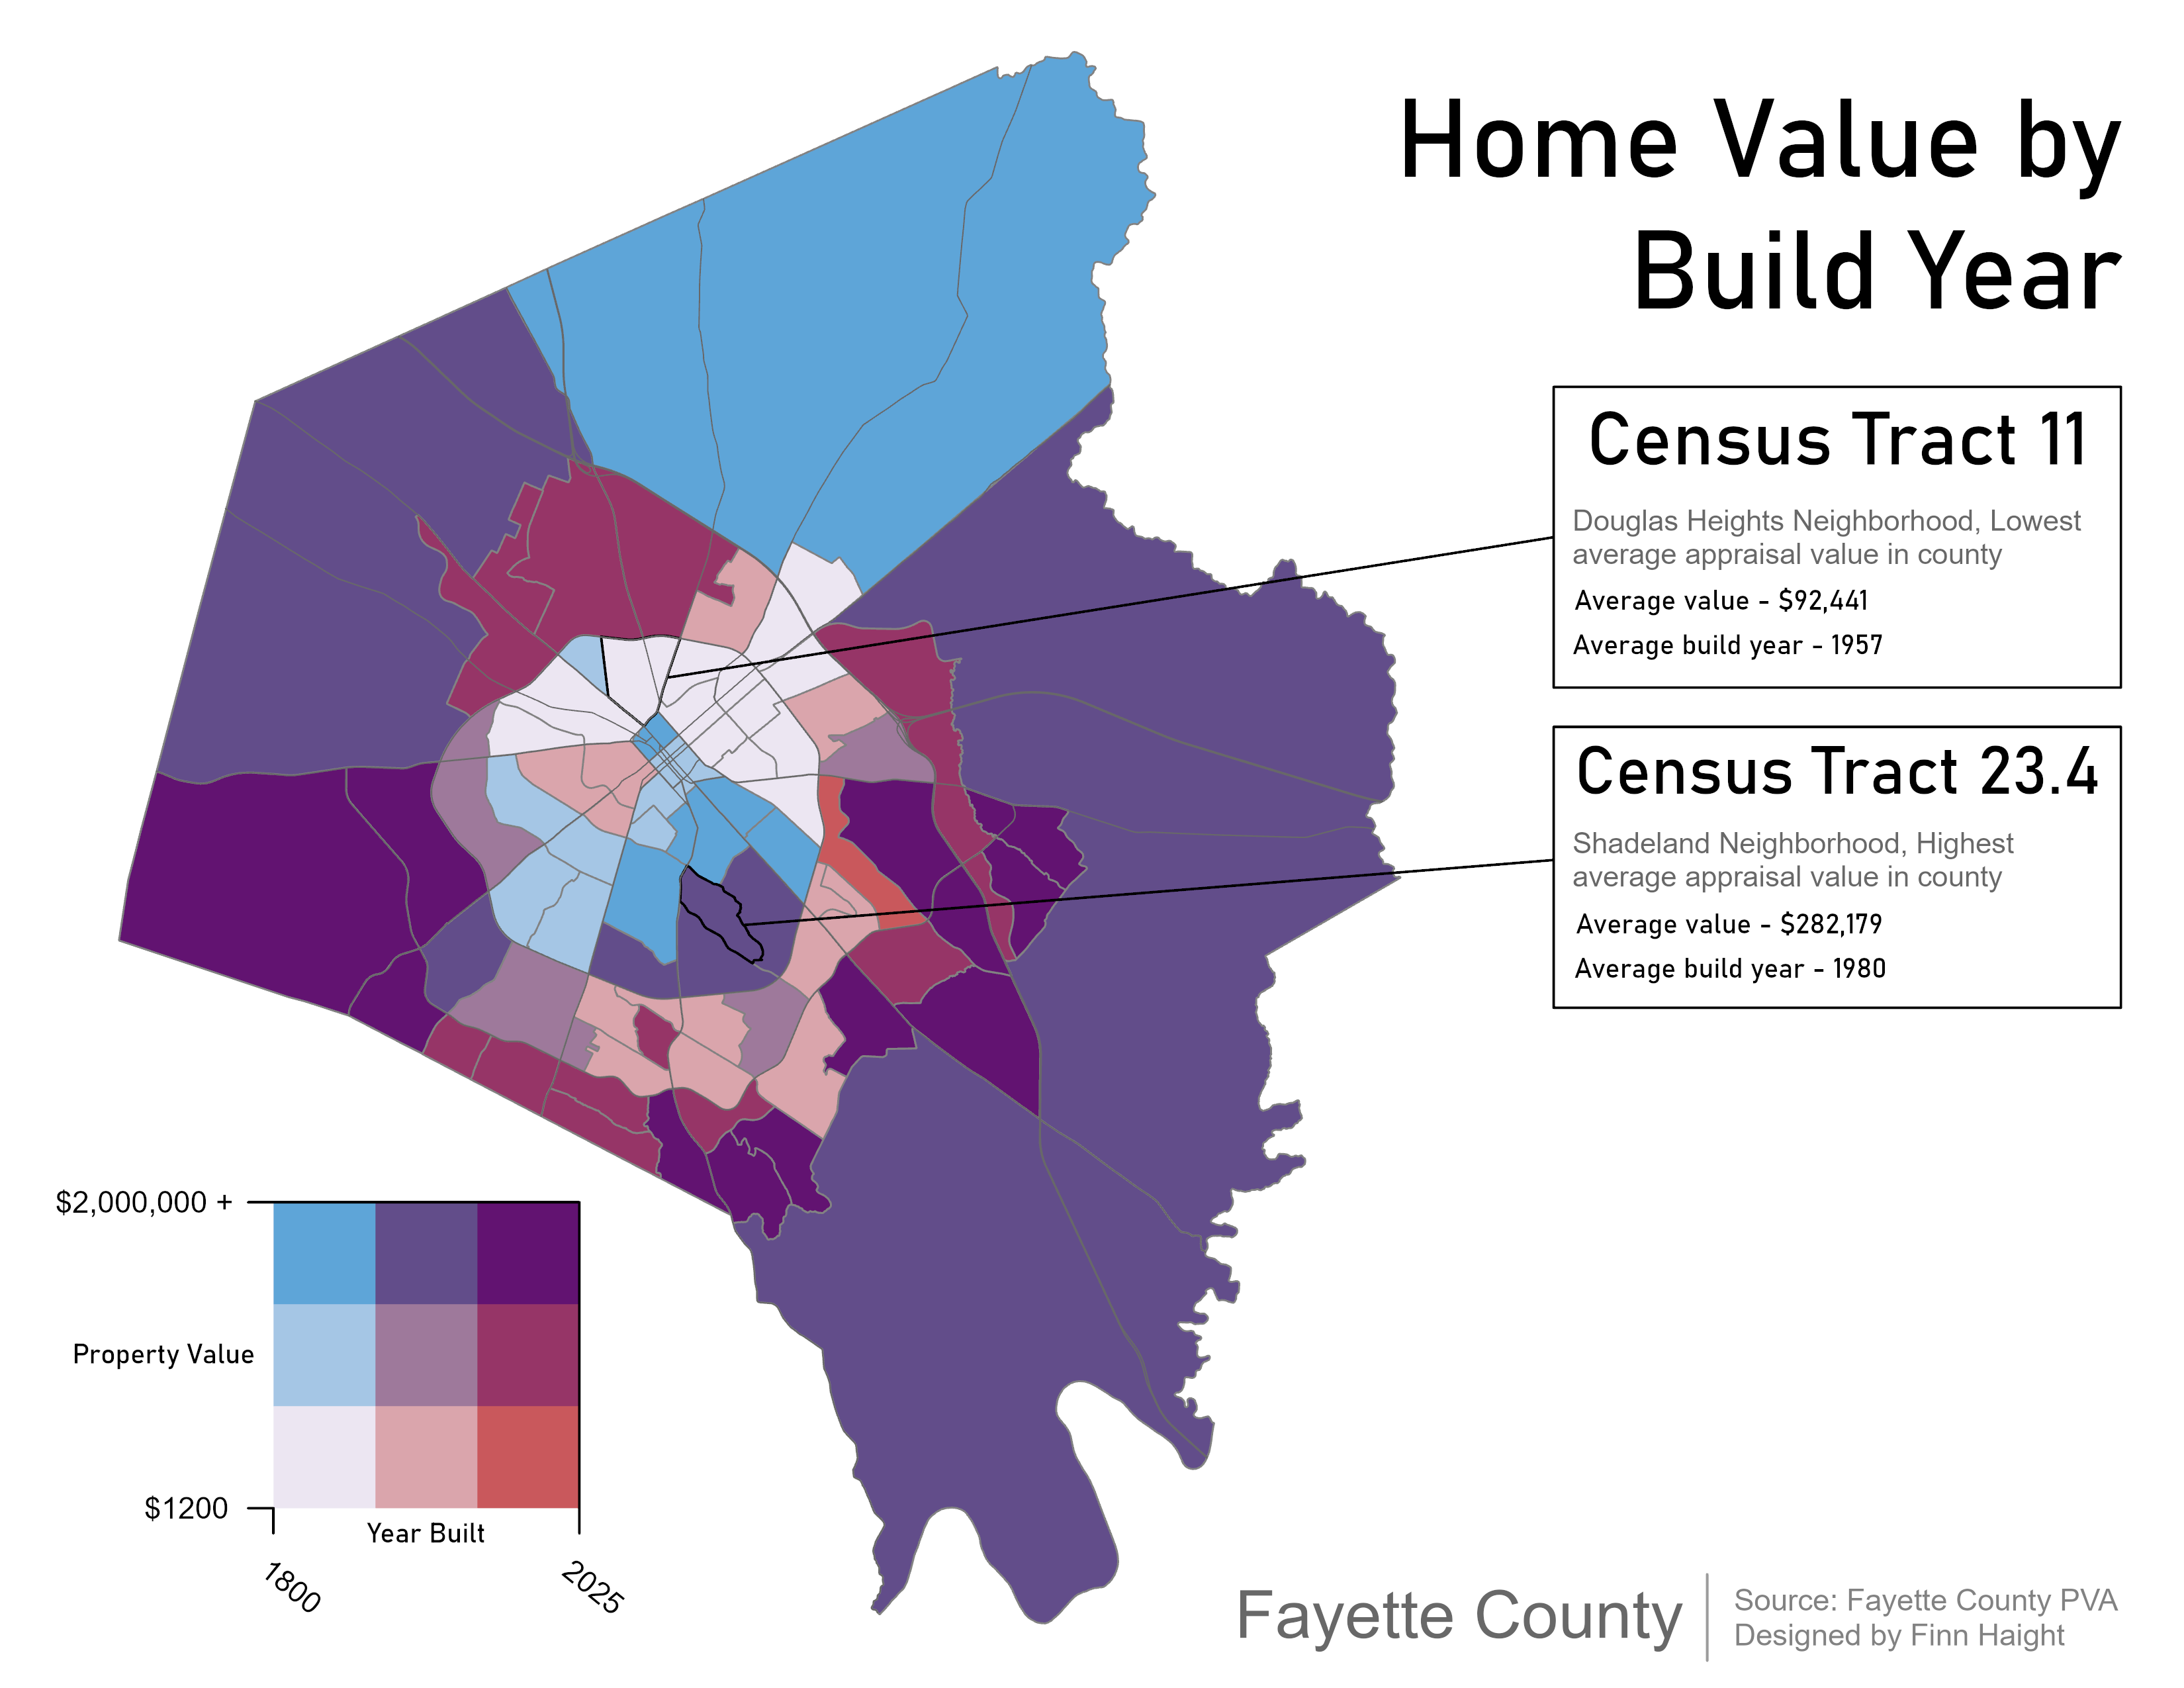
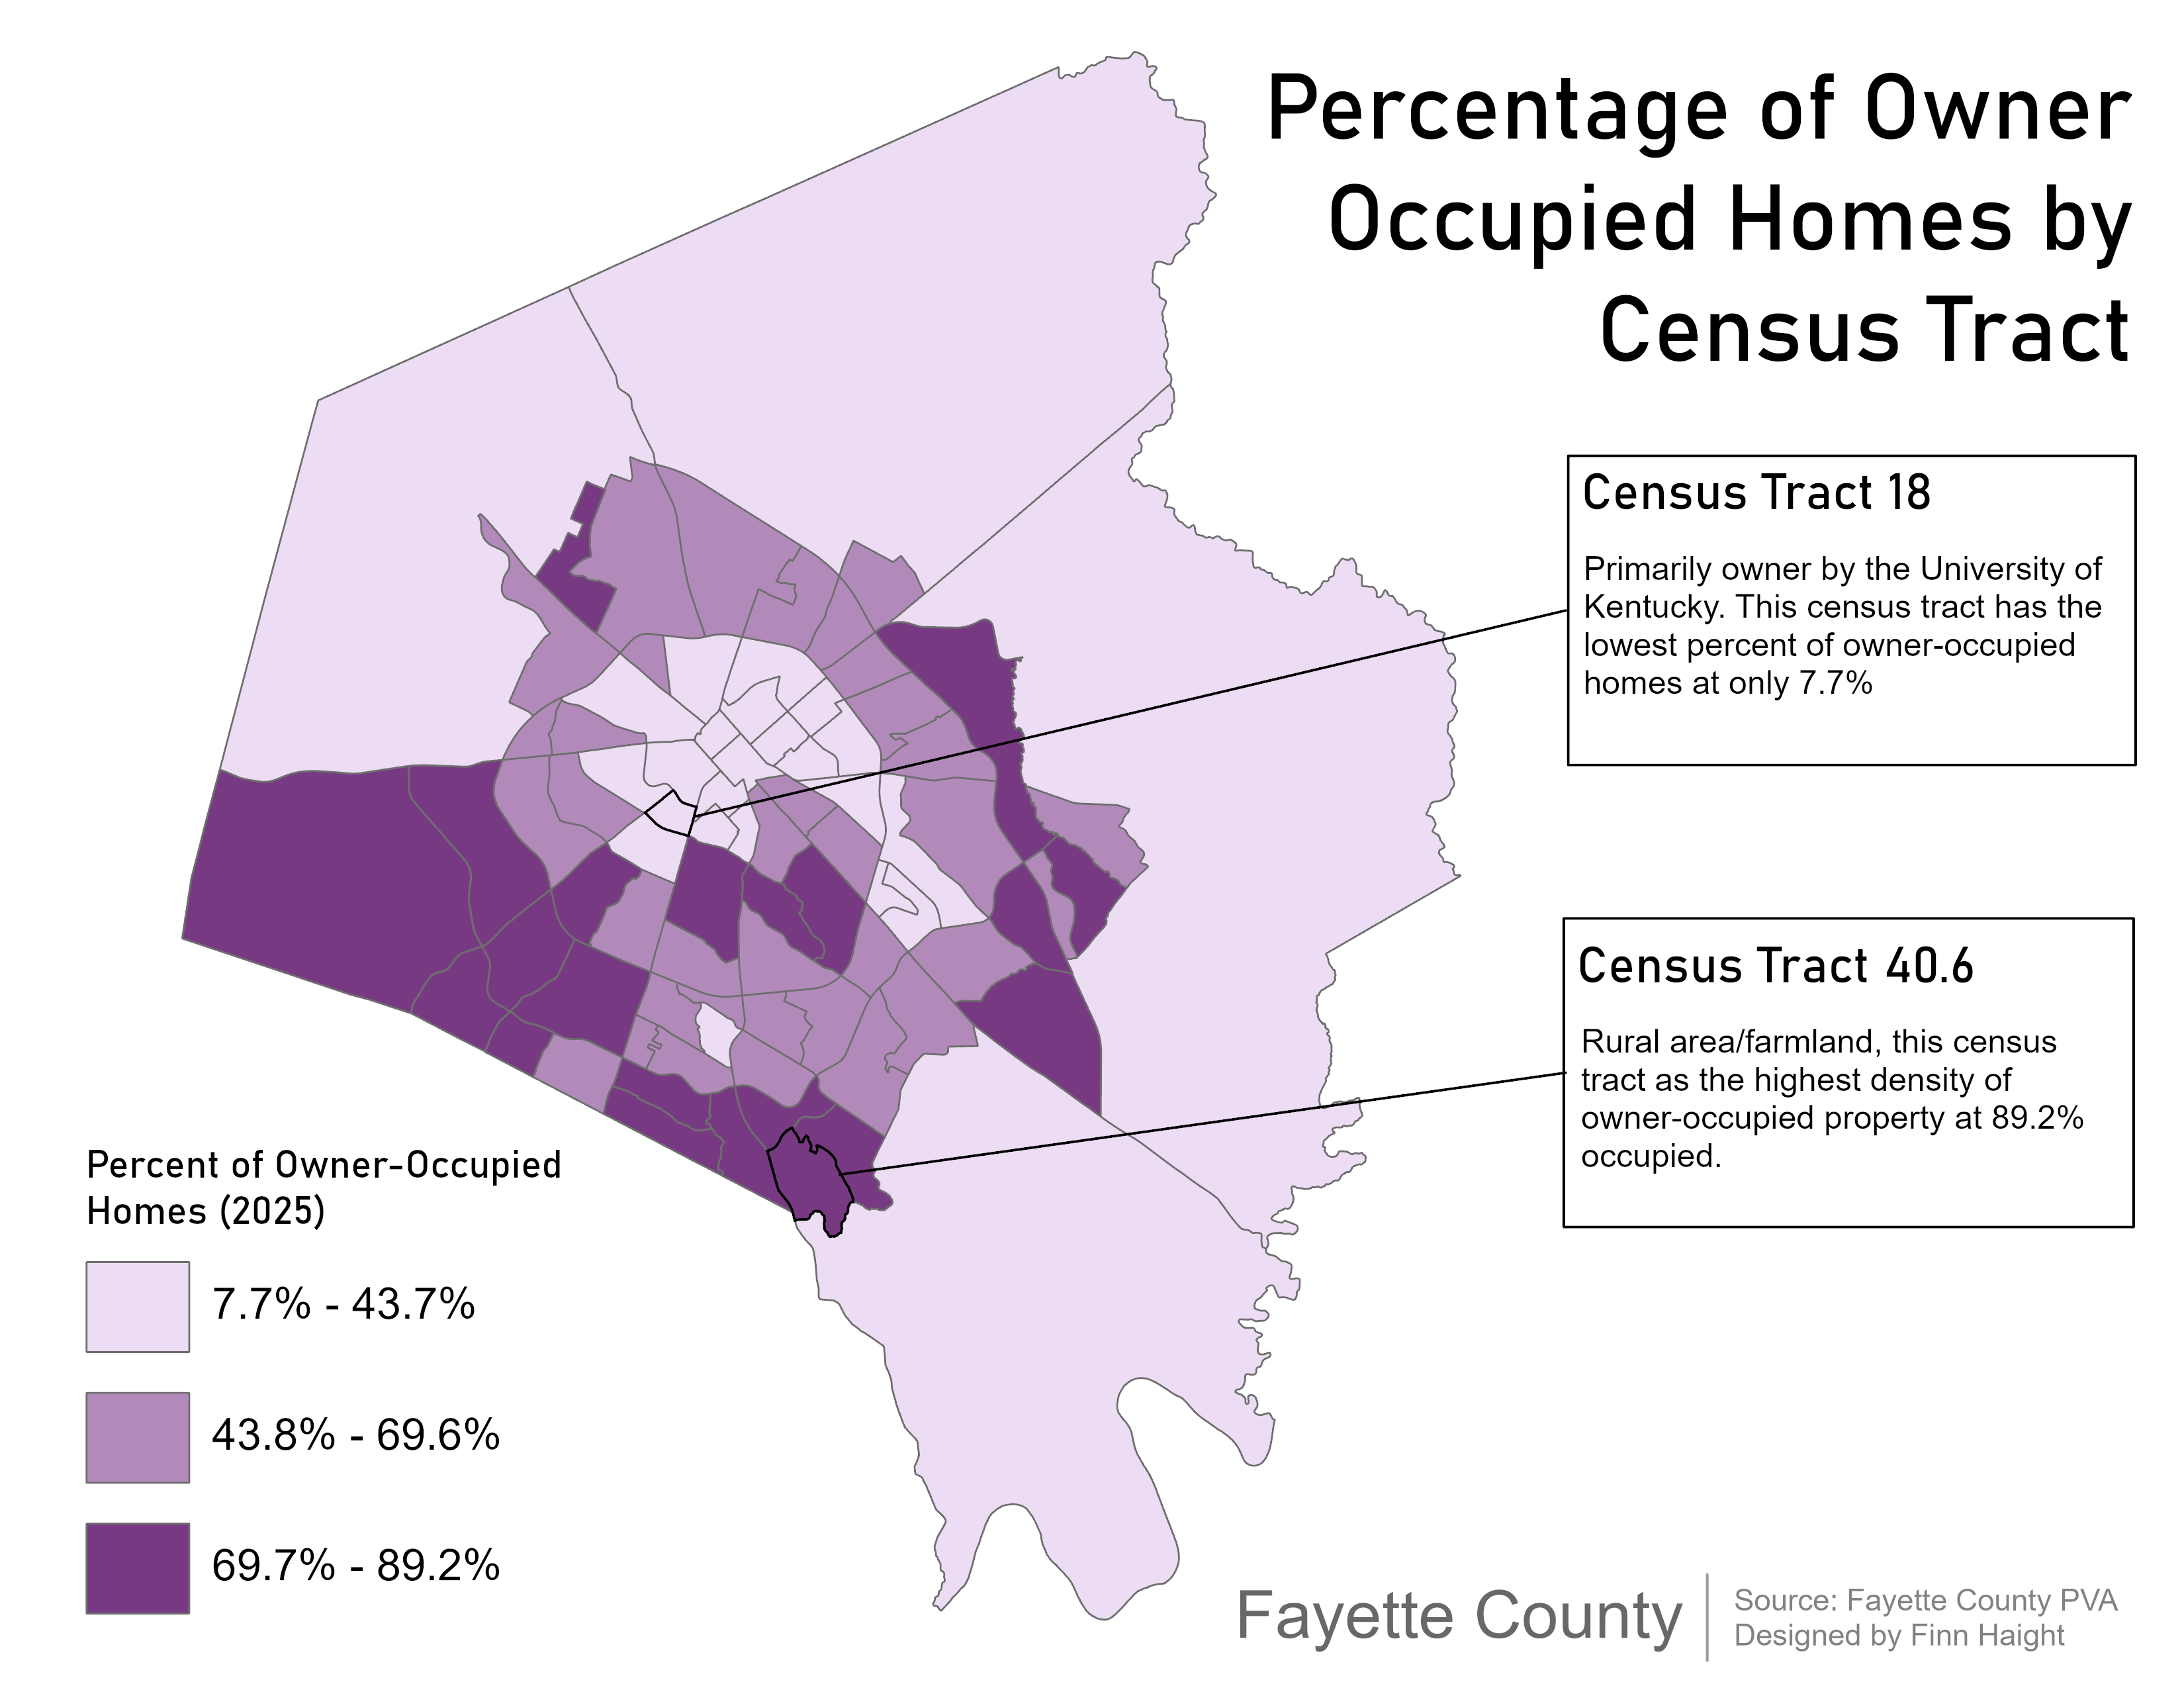
While working with the Fayette County PVA, I became interested in how the affordability of homes was affected by a variety of different factors. Having access to land valuation data and census bureau information allowed me to explore the relationship between home ownership, affordability, and demographics who might be vulnerable to increasing costs of living. With these maps, I also wanted to focus on keeping a consistent formatting, and constrained myself to displaying different kinds of information using a common area of interest in order to highlight the interrelatedness of these factors. The main takeaways from this project were the effect of the pandemic on housing costs, as well as outlining several areas of the county were residents are primarily older people and those with lower incomes. Being able to determine where these vulnerable populations live gives a better insight into the factors driving these issues, and allows for preventative action to be taken. Bivariate maps were essential for highlighting the interconnectivity of factors like land valuations, population demographics, and level of home ownership within the census tracts. The downside to this was the visual clutter brought by this method - trying to display supplemental information, like highlighting specific tracts and neighborhoods within these brightly colored maps required a minimalistic touch in order to preserve order and prevent things from getting too busy.
Senior Capstone Project: Lexington Bike Safety Assessment
For my senior capstone class, I was tasked with creating a series of maps depicting data across varying scales, from the entire county all the way down to a single street. I wanted to focus on bike safety within Fayette County because of my interest in sustainable transportation, and my genuine curiosity about the kind of support being shown for cyclists in a smaller city that is mostly car-centric. I started as zoomed-in as possible, focusing on the street level and the areas with the most incidents, then let the reader take a step backwards with the county and census maps in order to understand why I chose this specific street within downtown Lexington. For this project, we were limited to small layouts and grayscale coloration, so our layouts could easily be printed and distributed. Ultimately, this was a unique challenge that helped me learn more about choosing what kind of information to prioritize, as well as how to configure a layout with several different sections so the eye naturally follows the "story" that is being presented.
Trimble County Community Plan, Blueprint Kentucky
Created for Blueprint Kentucky's community development work with Trimble County, these maps were aimed at providing an assessment of the geospatial and environmental characteristics of the county and its seat, the town of Bedford. These maps were created with the use of lidar data, as well as Python scripts to develop accurate readings of NDVI values and point cloud visualizations. The layouts were created in strict adherence to a standard developed alongside a multidisciplinary team of design students and professionals, emphasizing clarity and legibility, and were polished with the use of Adobe InDesign. These particular maps use vegetation data and 3D imagery to show the density of trees and other plant life throughout Trimble County and Bedford, informing our recommendations for a shaded bike path connecting points of interest throughout the town. As part of a twenty year development plan devised over the course of the summer, these layouts were part of a wider master document presented to community members and press at the conclusion of the project. To serve this dual purpose, I wanted to make sure that the data included in these maps was as accurate as possible, as well as that it was being presented in a way that clearly communicated information in a way that could be understood by laypersons as well as expert professionals. This document has received an Honor award from the Kentucky chapter of the American Society of Landscape Architects.